Tying a Bow

Whenever I have to go to a formal event, I always have to look up how to tie a bowtie. Then I have to make several attempts to get it right.
Fortunately bowtie diagrams are much less convoluted, and I think of them as a hybridised version of attack/fault and event trees.
While they were developed for oil and gas risk management, they're a useful visual approach for any form of risk management.
You may have noticed that the earliest posts in this lean heavily on visual tools. That's because, by and large, we as humans are visual creatures and comprehend things drawn out much more instinctively than other formats. Don't worry, other tools will be introduced as we go along.
Be ready for some new terminology on this one, and check the footnotes if you're unfamiliar.
When to Use It
When you're trying to assess a risk more thoroughly than just considering the impact, or the causes, to give you ways to manage it.
How It Works
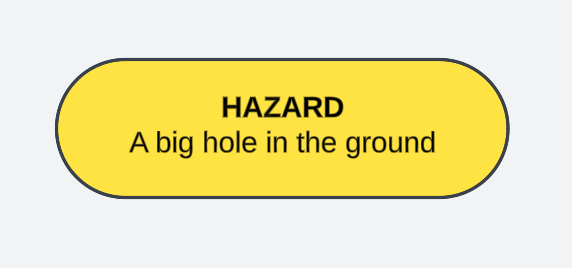
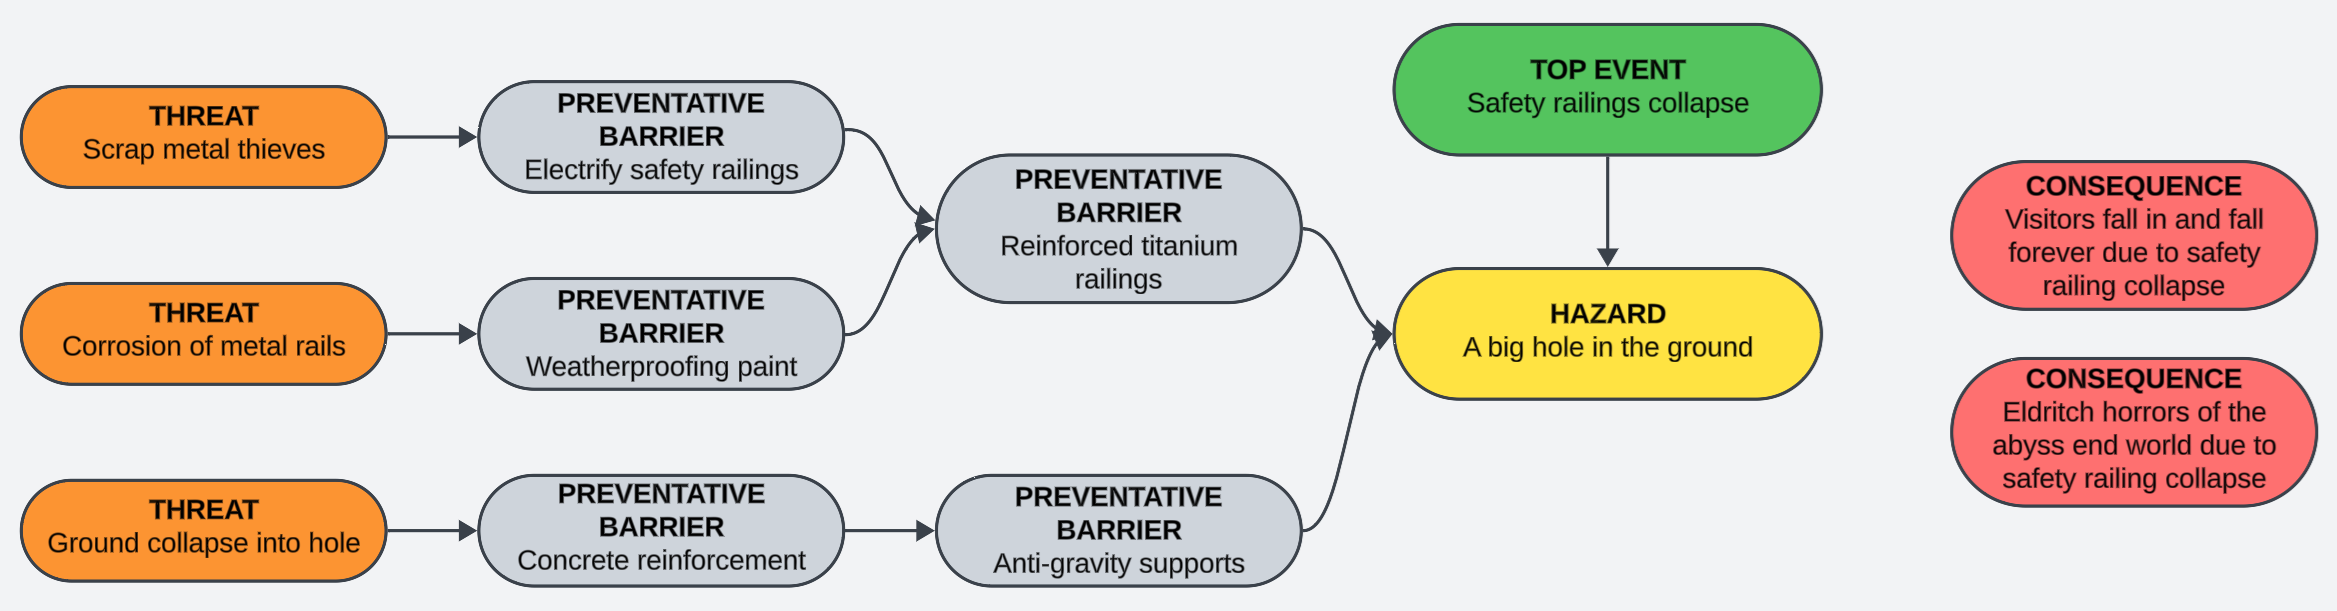
The first thing you need to do with a bowtie diagram is identify the hazard that you're examining. This forms the 'knot' of the tie.
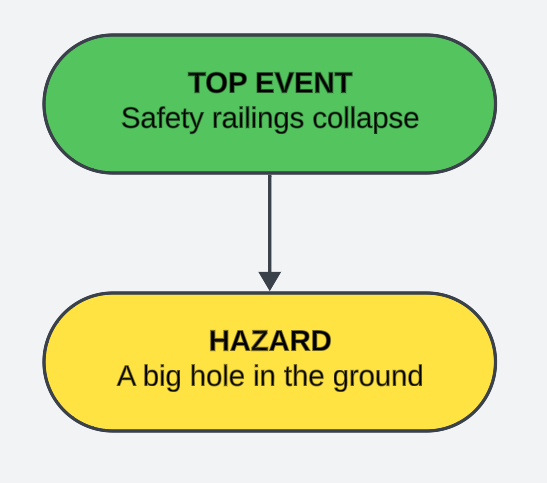
Next we select our top event (also goes under the pseudonyms loss of control, or control failure. It's important to recognise that the top event is not the impact, nor the risk. It is the point at which we have lost an acceptable level of control over the situation. If we were talking about driving, it might be the point at which you start to skid - a crash isn't inevitable, but your control over whether or not you crash at that point is not something most drivers would be willing to accept.
The next step is to move to the left of the bow and start identifying threats (a.k.a. causes). Threats are those things, environmental or otherwise, which can cause the loss of control. Safety threats will be static and environmental, while security threats are dynamic with agency and motivations.
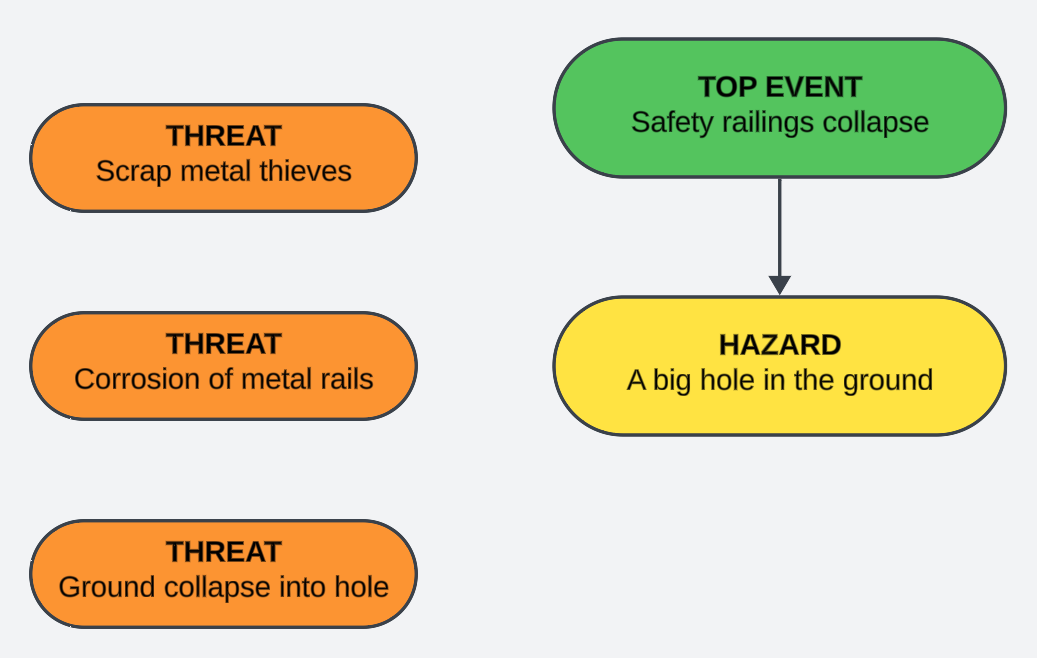
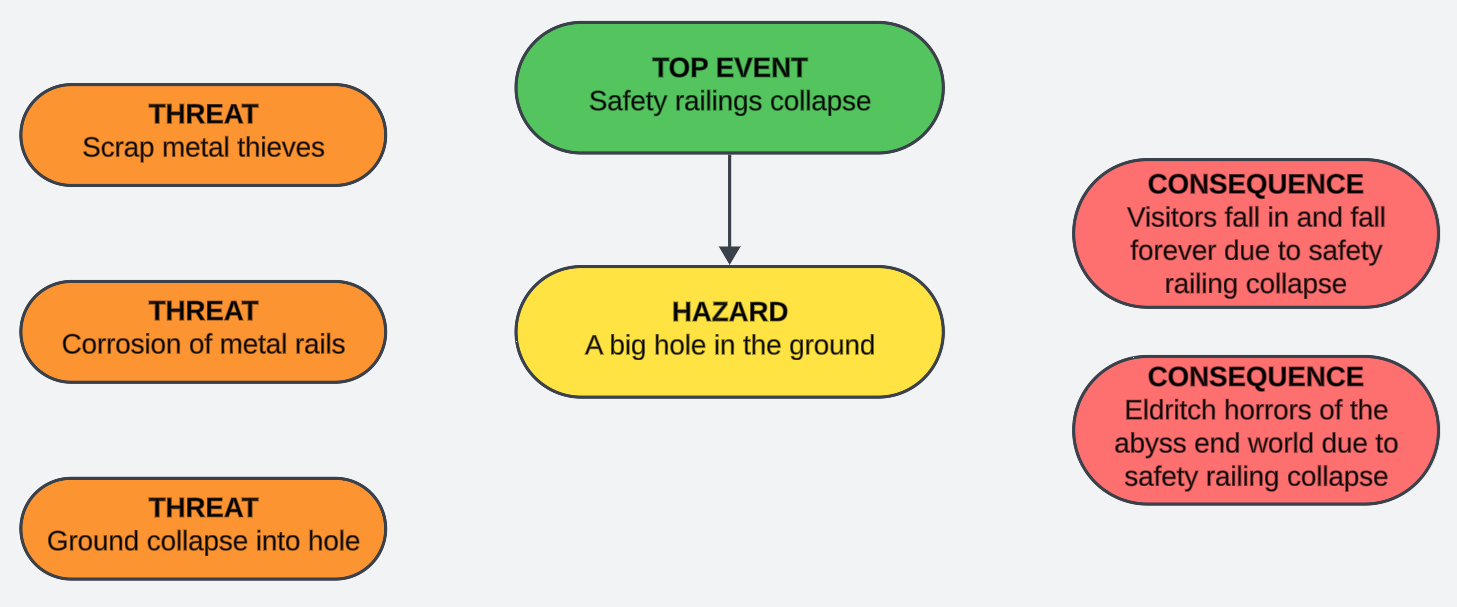
As you can see, we haven't connected our threats yet. We'll get to that, but the next step is to move to the right and start thinking about consequences. In some risk management schools, you may come across these being described as impact.
We're over halfway now. This is when we start connecting things up. We'll start on the threat side, and for each one we want to identify one (or more) preventative barriers (may be referred to as a preventative control, or just a control) which will help prevent the threat from causing the top event and leading to consequences.
These barriers can be chained together, and one threat may share barriers with others.
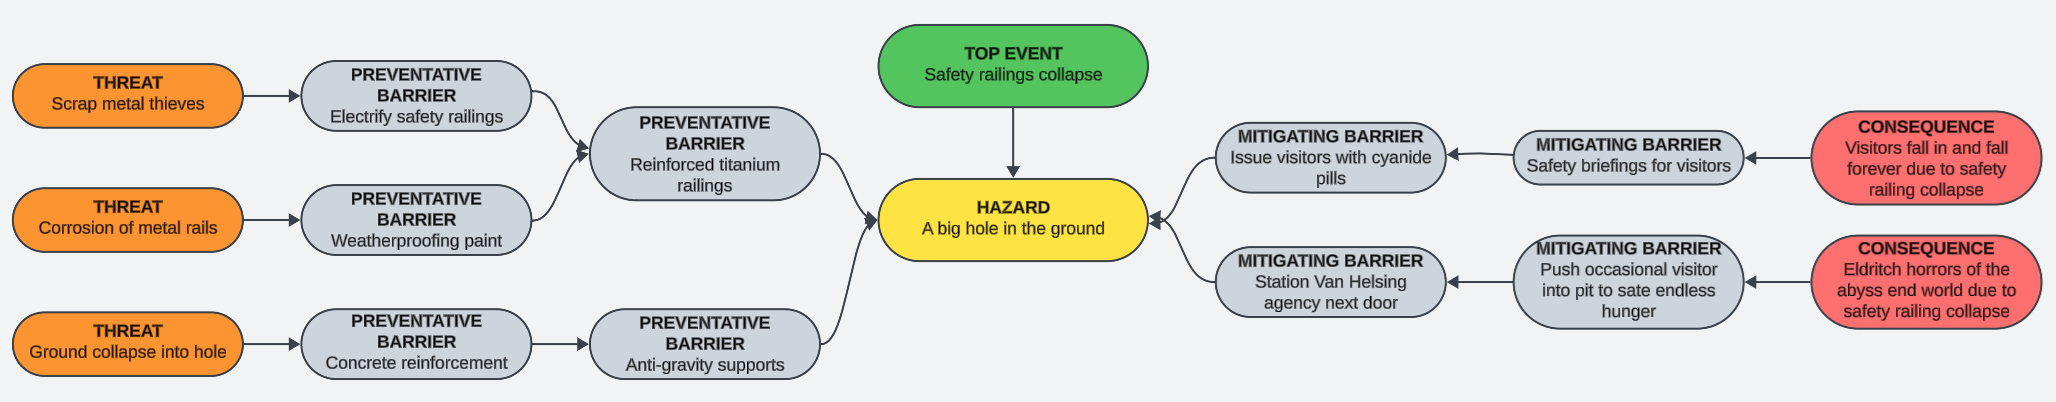
Next, we look at consequences and start to put in place one or more mitigating barriers (again, control may be substituted for barrier) which will help to prevent the consequence from taking full effect, or occurring at all.
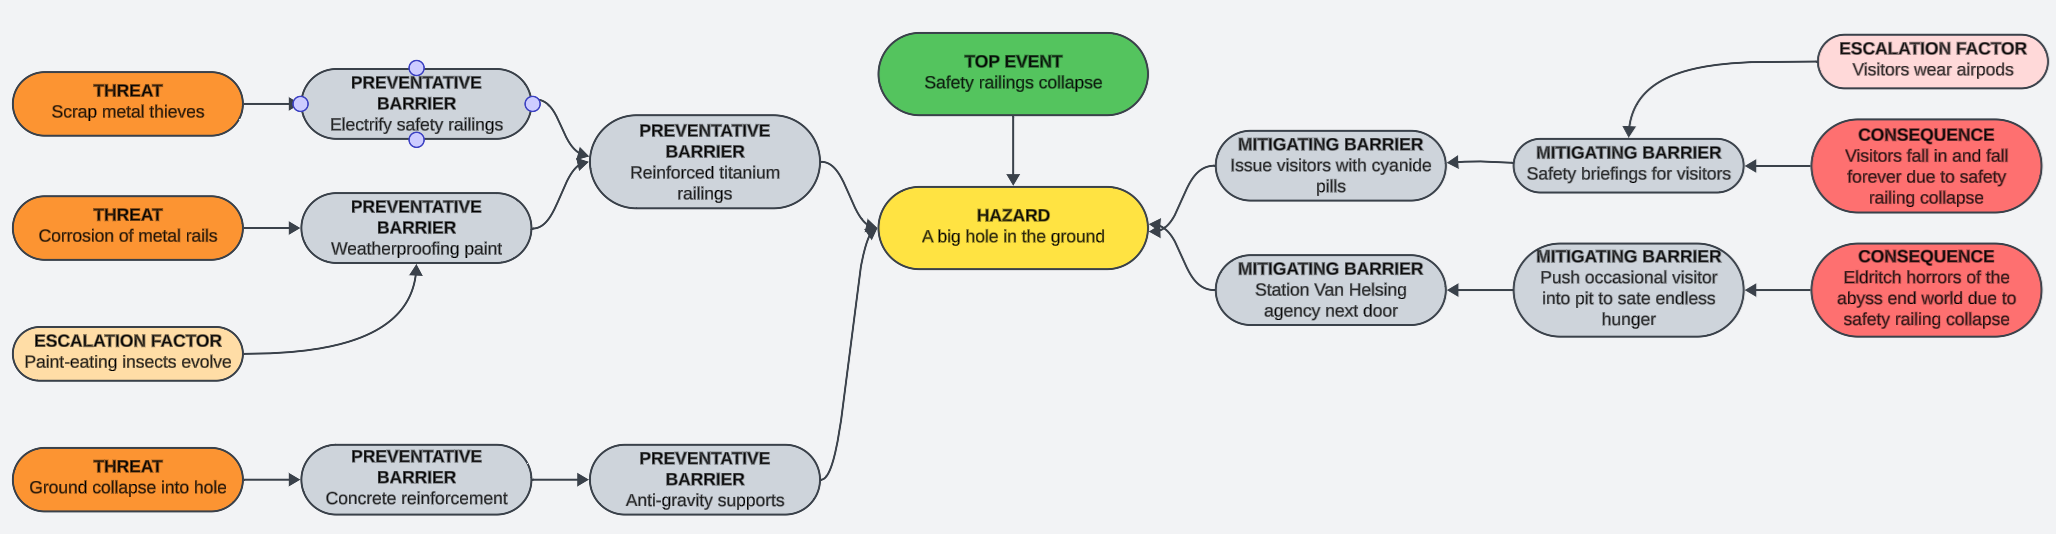
We're not quite done yet, because we do have one more step. We need to look at the diagram in its entirety and identify any escalation factors (also known as degradation factors). These are factors that affect the barriers themselves rather than in some way strengthening the threat, and should be both appropriate and realistic.
You can enhance this approach by adding a lot of metadata - such as adding quantitative data, classifications of different threats, creating multiple bowties, and more. This is just the basic approach.